How AI is revolutionising data visualisation, and why it matters
Goitsemang Moagi, Data Engineer at PBT Group
Data is everywhere – from business performance and sales reports to social media metrics. But raw data alone does not lead to better decisions. What truly drives impact are the insights extracted from raw data. For years, uncovering such insights required manual analysis, complex tools, and deep technical skills. This is changing rapidly. Artificial Intelligence (AI) is revolutionising data visualisation, making it faster, smarter, and more accessible to everyone, not just analysts and data engineers.
Instead of static charts and dashboards that require users to interpret trends on their own, AI now turns overwhelming datasets into clear, dynamic, and interactive visuals. More than that, it explains what the data means in plain language. Tools like Power BI Copilot and Tableau Pulse are already leading this evolution by letting users ask natural-language questions and receive instant, contextual insights. In essence, AI is becoming your data storyteller.
Gaining new understanding
This is a massive shift. Where data visualisation was once a passive process—you saw the numbers and then decided what to do—AI is now bridging the gap between insight and action. In fields like finance, for instance, AI does not just show you a trend in stock performance; it can make predictive recommendations or even execute actions based on those patterns. In logistics and healthcare, AI-driven dashboards can surface anomalies, highlight risks, and offer mitigation steps—all within the same interface.
Much-needed insights
What truly excites me as a data engineer is how AI is also improving the quality of insights. Before visuals even hit your screen, AI is checking and cleaning the data, flagging potential issues like missing values or inconsistencies, meaning that these can be corrected before they distort reports. This is critical in fields like healthcare and finance, where bad data can lead to costly mistakes.
A personal touch
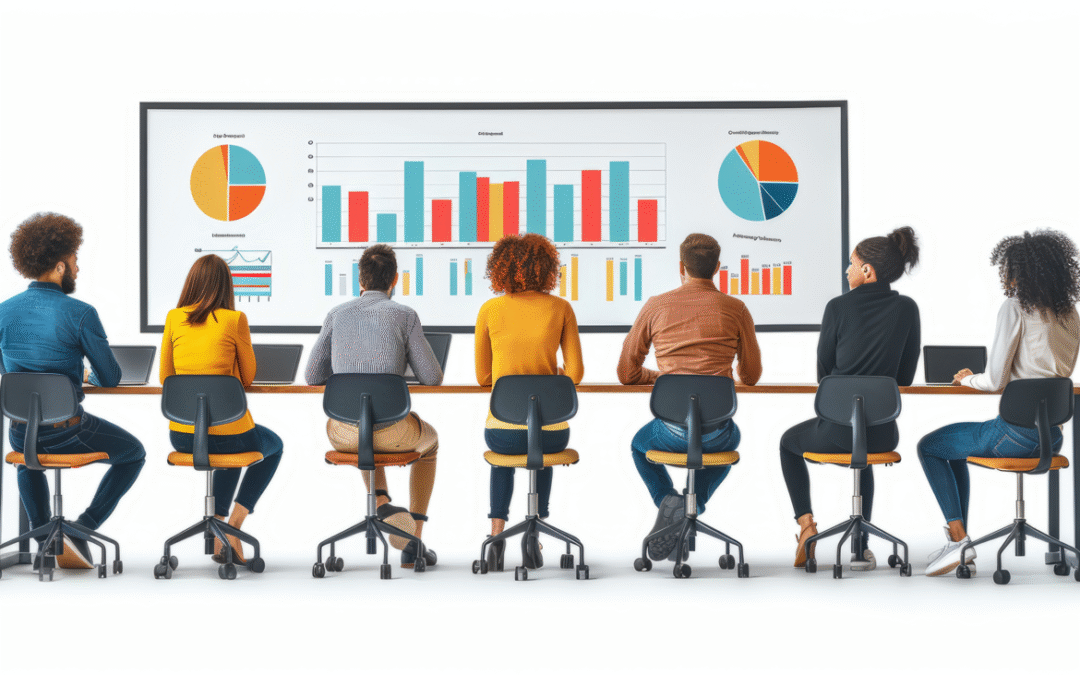
Another area where AI is changing the game is personalisation. Not everyone needs the same view of the data. With AI, dashboards can now adapt to who is looking at them. A data engineer might see detailed technical insights like anomaly detection graphs, while a marketing executive sees high-level trends and key takeaways. This kind of user-centric design reduces noise and ensures each stakeholder gets the information they need, in the format that makes sense to them.
Controlled effort
Of course, none of this works without strong data governance and quality control. AI is only as good as the data it learns from. For businesses to benefit fully from AI-powered visualisation, they need clean, well-structured data and clear governance practices in place. That means understanding where your data comes from, who owns it, how it is processed, and ensuring compliance with regulations like POPIA, GDPR, or HIPAA.
This is not just about making reporting more efficient. Rather, it is about creating a culture where data becomes part of every decision. AI helps break down technical barriers so more people can engage with data and make informed choices. But as we hand over more responsibility to machines, we must also reinforce the guardrails that ensure the insights we act on are trustworthy.
AI leading the way
Looking ahead, we are entering a world where AI will do more than help us see what is happening. It will help us understand why it is happening, what could happen next, and what to do about it. And it will do this in a way that is tailored, reliable, and almost instant.
That is why this shift matters. AI in data visualisation is not just about fancier charts. It is about unlocking the full value of data—faster, clearer, and more confidently than ever before. But to get there, we must lay the right foundations. With the right data governance, quality assurance, and mindset, AI can help organisations of all sizes move from data-aware to truly data-driven.


